Catalog
With stdpopsim, you can run simulations from a number of demographic models
that were implemented from published demographic histories. These models have been
rigorously checked and tested by multiple people, so you can rest easy knowing that
your simulations are reproducible and bug-free!
This catalog shows you all of the possible options that you can use to configure
your simulation.
It is organised around a number of choices that you’ll need to make about the
Species you wish to simulate:
Which chromosome? (ie. which
Genomeobject?)Which genetic map? (ie. which
GeneticMapobject?)Which model of demographic history? (ie. which
DemographicModelobject)
For instance, suppose you are interested in simulating modern human samples of
chromosome 22, using
the HapMapII genetic map, under
a 3-population Out-of-Africa model.
The following command simulates 2 samples from each of the three populations,
and saves the output to a file called test.trees:
$ stdpopsim HomSap -c chr22 -o test.trees -g HapMapII_GRCh37 -d OutOfAfrica_3G09 2 2 2
(To learn more about using stdpopsim via the command-line, read our
tutorial about it.)
Are there other well-known organisms, genetic maps or models that
you’d like to see in stdpopsim? Head to our Development
page to learn about the process for adding new items to the catalog.
Then, if you feel ready, make an issue on our
GitHub page.
Arabidopsis thaliana
- ID
AraTha
- Name
Arabidopsis thaliana
- Common name
A. thaliana
- Generation time
1.0 (Donohue, 2002)
- Population size
10000 (1001GenomesConsortium, 2016)
Genome
ID |
Length |
Recombination rate |
Mutation rate |
|---|---|---|---|
1 |
30427671 |
8.06452e-10 |
7e-09 |
2 |
19698289 |
8.06452e-10 |
7e-09 |
3 |
23459830 |
8.06452e-10 |
7e-09 |
4 |
18585056 |
8.06452e-10 |
7e-09 |
5 |
26975502 |
8.06452e-10 |
7e-09 |
Mt |
366924 |
0 |
7e-09 |
Pt |
154478 |
0 |
7e-09 |
Genetic Maps
ID |
Year |
Description |
|---|---|---|
2012 |
Crossover frequency map averaged over 17 populations |
SalomeAveraged_TAIR7
This map is based on the study of crossover frequencies in over 7000 plants in 17 F2 populations derived from crosses between 18 A. thaliana accessions. Salomé et al provide genetic maps for each of these populations. To get a single map for each chromosome, the Haldane map function distances were converted to recombination rates (cM/Mb) for each cross and then averaged across the 17 populations using loess.
Citations
Salomé et al., 2012. https://doi.org/10.1038/hdy.2011.95
Demographic Models
ID |
Description |
|---|---|
South Middle Atlas piecewise constant size |
|
South Middle Atlas African two epoch model |
|
South Middle Atlas African three epoch model |
South Middle Atlas piecewise constant size
This model comes from MSMC using two randomly sampled homozygous individuals (Khe32 and Ifr4) from the South Middle Atlas region from the Middle Atlas Mountains in Morocco. The model is estimated with 32 time periods. Because estimates from the recent and ancient past are less accurate, we set the population size in the first 7 time periods equal to the size at the 8th time period and the size during last 2 time periods equal to the size in the 30th time period.
Details
- ID
SouthMiddleAtlas_1D17
- Description
South Middle Atlas piecewise constant size
- Num populations
1
Populations
Index |
ID |
Sampling time |
Description |
|---|---|---|---|
0 |
0 |
0 |
Arabidopsis Thaliana South Middle Atlas population |
Citations
Durvasula et al., 2017. https://doi.org/10.1073/pnas.1616736114
Demographic Model parameters
Parameter Type (units) |
Value |
Description |
|---|---|---|
Population size |
73,989 |
Ancestral population size |
Population size |
121,796 |
Pop. size during 1st time interval |
Population size |
165,210 |
Pop. size during 2nd time interval |
Population size |
198,019 |
Pop. size during 3rd time interval |
Population size |
217,752 |
Pop. size during 4th time interval |
Population size |
228,222 |
Pop. size during 5th time interval |
Population size |
238,593 |
Pop. size during 6th time interval |
Population size |
246,984 |
Pop. size during 7th time interval |
Population size |
241,400 |
Pop. size during 8th time interval |
Population size |
217,331 |
Pop. size during 9th time interval |
Population size |
181,571 |
Pop. size during 10th time interval |
Population size |
143456 |
Pop. size during 11th time interval |
Population size |
111,644 |
Pop. size during 12th time interval |
Population size |
91,813 |
Pop. size during 13th time interval |
Population size |
83,829 |
Pop. size during 14th time interval |
Population size |
83,932 |
Pop. size during 15th time interval |
Population size |
87,661 |
Pop. size during 16th time interval |
Population size |
96,283 |
Pop. size during 17th time interval |
Population size |
110,745 |
Pop. size during 18th time interval |
Population size |
111,132 |
Pop. size during 19th time interval |
Population size |
78,908 |
Pop. size during 20th time interval |
Time (yrs.) |
1,537,686 |
Begining of 1st time interval |
Time (yrs.) |
1,119,341 |
Begining of 2nd time interval |
Time (yrs.) |
954,517 |
Begining of 3rd time interval |
Time (yrs.) |
813,610 |
Begining of 4th time interval |
Time (yrs.) |
693,151 |
Begining of 5th time interval |
Time (yrs.) |
590,173 |
Begining of 6th time interval |
Time (yrs.) |
502,139 |
Begining of 7th time interval |
Time (yrs.) |
426,879 |
Begining of 8th time interval |
Time (yrs.) |
362,541 |
Begining of 9th time interval |
Time (yrs.) |
307,540 |
Begining of 10th time interval |
Time (yrs.) |
260,520 |
Begining of 11th time interval |
Time (yrs.) |
220,324 |
Begining of 12th time interval |
Time (yrs.) |
185,960 |
Begining of 13th time interval |
Time (yrs.) |
156,584 |
Begining of 14th time interval |
Time (yrs.) |
131,471 |
Begining of 15th time interval |
Time (yrs.) |
110,001 |
Begining of 16th time interval |
Time (yrs.) |
91,648 |
Begining of 17th time interval |
Time (yrs.) |
75,958 |
Begining of 18th time interval |
Time (yrs.) |
62,544 |
Begining of 19th time interval |
Time (yrs.) |
51,077 |
Begining of 20th time interval |
Generation time (yrs.) |
1 |
Average generation interval |
Mutation rate |
7.1e-9 |
Per-base per-generation mutation rate |

South Middle Atlas African two epoch model
Model estimated from site frequency spectrum of synonymous SNPs from African South Middle Atlas samples using Williamson et al. 2005 methodology. Values come from supplementary table 1 of Huber et al 2018. Sizes change from N_A -> N_0 and t_1 is time of the second epoch.
Details
- ID
African2Epoch_1H18
- Description
South Middle Atlas African two epoch model
- Num populations
1
Populations
Index |
ID |
Sampling time |
Description |
|---|---|---|---|
0 |
0 |
0 |
Arabidopsis Thaliana South Middle Atlas population |
Citations
Huber et al., 2018. https://doi.org/10.1038/s41467-018-05281-7
Demographic Model parameters
Parameter Type (units) |
Value |
Description |
|---|---|---|
Population size |
746,148 |
Ancestral pop. size |
Population size |
100,218 |
Pop. size during second epoch |
Epoch Time (gen.) |
568,344 |
Time of second epoch |
Generation time (yrs.) |
1 |
Average generation interval |
Mutation rate |
7e-9 |
Per-base per-generation mutation rate |

South Middle Atlas African three epoch model
Model estimated from site frequency spectrum of synonymous SNPs from African (South Middle Atlas) samples using Williamson et al. 2005 methodology. Values come from supplementary table 1 of Huber et al 2018. Sizes change from N_A -> N_2 -> N_3 and t_2 is the time of the second epoch and t_3 is the time of the 3rd epoch.
Details
- ID
African3Epoch_1H18
- Description
South Middle Atlas African three epoch model
- Num populations
1
Populations
Index |
ID |
Sampling time |
Description |
|---|---|---|---|
0 |
0 |
0 |
Arabidopsis Thaliana South Middle Atlas population |
Citations
Huber et al., 2018. https://doi.org/10.1038/s41467-018-05281-7
Demographic Model parameters
Parameter Type (units) |
Value |
Description |
|---|---|---|
Population size |
161,744 |
Ancestral pop. size |
Population size |
24,076 |
Pop. size during second epoch |
Population size |
203,077 |
Pop. size during Third epoch |
Epoch Time (gen.) |
7,420 |
Time of second epoch |
Epoch Time (gen.) |
14,534 |
Time of third epoch |
Generation time (yrs.) |
1 |
Average generation interval |
Mutation rate |
7e-9 |
Per-base per-generation mutation rate |

Annotations
ID |
Year |
Description |
|---|
Distribution of Fitness Effects (DFEs)
ID |
Year |
Description |
|---|
Canis familiaris
- ID
CanFam
- Name
Canis familiaris
- Common name
Dog
- Generation time
3
- Population size
13000 (Lindblad-Toh et al., 2005)
Genome
ID |
Length |
Recombination rate |
Mutation rate |
|---|---|---|---|
1 |
122678785 |
7.636e-09 |
4e-09 |
2 |
85426708 |
8.79852e-09 |
4e-09 |
3 |
91889043 |
8.00087e-09 |
4e-09 |
4 |
88276631 |
8.0523e-09 |
4e-09 |
5 |
88915250 |
9.34433e-09 |
4e-09 |
6 |
77573801 |
8.19219e-09 |
4e-09 |
7 |
80974532 |
7.29347e-09 |
4e-09 |
8 |
74330416 |
8.29131e-09 |
4e-09 |
9 |
61074082 |
9.28772e-09 |
4e-09 |
10 |
69331447 |
9.10715e-09 |
4e-09 |
11 |
74389097 |
7.63945e-09 |
4e-09 |
12 |
72498081 |
7.76106e-09 |
4e-09 |
13 |
63241923 |
8.41302e-09 |
4e-09 |
14 |
60966679 |
9.02812e-09 |
4e-09 |
15 |
64190966 |
7.85675e-09 |
4e-09 |
16 |
59632846 |
8.61406e-09 |
4e-09 |
17 |
64289059 |
9.71883e-09 |
4e-09 |
18 |
55844845 |
1.02993e-08 |
4e-09 |
19 |
53741614 |
1.04251e-08 |
4e-09 |
20 |
58134056 |
9.99097e-09 |
4e-09 |
21 |
50858623 |
1.0339e-08 |
4e-09 |
22 |
61439934 |
8.61505e-09 |
4e-09 |
23 |
52294480 |
9.12664e-09 |
4e-09 |
24 |
47698779 |
1.1146e-08 |
4e-09 |
25 |
51628933 |
1.15437e-08 |
4e-09 |
26 |
38964690 |
1.20846e-08 |
4e-09 |
27 |
45876710 |
1.12603e-08 |
4e-09 |
28 |
41182112 |
1.24636e-08 |
4e-09 |
29 |
41845238 |
1.10136e-08 |
4e-09 |
30 |
40214260 |
1.16876e-08 |
4e-09 |
31 |
39895921 |
1.13977e-08 |
4e-09 |
32 |
38810281 |
1.15559e-08 |
4e-09 |
33 |
31377067 |
1.33394e-08 |
4e-09 |
34 |
42124431 |
1.04838e-08 |
4e-09 |
35 |
26524999 |
1.42991e-08 |
4e-09 |
36 |
30810995 |
1.18752e-08 |
4e-09 |
37 |
30902991 |
1.38346e-08 |
4e-09 |
38 |
23914537 |
1.43637e-08 |
4e-09 |
X |
123869142 |
9.50648e-09 |
4e-09 |
MT |
16727 |
0 |
4e-09 |
Genetic Maps
ID |
Year |
Description |
|---|---|---|
2016 |
Pedigree-based crossover map from 237 individuals |
Campbell2016_CanFam3_1
Sex-averaged crossover frequency map based on 163,400 autosomal SNPs genotyped in a pedigree of 237 Labrador Retriever x Greyhound crosses. Genotypes were phased without respect to the pedigree, using SHAPEIT2, recombinations were called using duoHMM, and genetic distances were obtained using Haldane’s map function.
Citations
Campbell et al., 2016. https://doi.org/10.1534/g3.116.034678
Demographic Models
ID |
Description |
|---|
Annotations
ID |
Year |
Description |
|---|
Distribution of Fitness Effects (DFEs)
ID |
Year |
Description |
|---|
Drosophila melanogaster
- ID
DroMel
- Name
Drosophila melanogaster
- Common name
D. melanogaster
- Generation time
0.1 (Li et al., 2006)
- Population size
1720600 (Li et al., 2006)
Genome
ID |
Length |
Recombination rate |
Mutation rate |
|---|---|---|---|
2L |
23513712 |
2.40463e-08 |
5.49e-09 |
2R |
25286936 |
2.23459e-08 |
5.49e-09 |
3L |
28110227 |
1.7966e-08 |
5.49e-09 |
3R |
32079331 |
1.71642e-08 |
5.49e-09 |
4 |
1348131 |
2.0058e-08 |
5.49e-09 |
X |
23542271 |
2.89651e-08 |
5.49e-09 |
Y |
3667352 |
0 |
5.49e-09 |
mitochondrion_genome |
19524 |
0 |
5.49e-09 |
Genetic Maps
ID |
Year |
Description |
|---|---|---|
2012 |
Crossover map from meioses products of 8 lab crosses |
|
2012 |
Crossover map from meioses products of 8 lab crosses |
ComeronCrossover_dm6
The crossover map from a study of 8 crosses of 12 highly inbred lines of D. melanogaster. This is based on the products of 5,860 female meioses from whole genome sequencing data. Recombination rates were calculated from the density of individual recombination events that were detected in crosses. This map was subsequently lifted over to the dm6 assembly.
Citations
Comeron et al, 2012. https://doi.org/10.1371/journal.pgen.1002905
ComeronCrossoverV2_dm6
The crossover map from a study of 8 crosses of 12 highly inbred lines of D. melanogaster. This is based on the products of 5,860 female meioses from whole genome sequencing data. Recombination rates were calculated from the density of individual recombination events that were detected in crosses. This map was subsequently lifted over to the dm6 assembly using the available maintenance code command: python liftOver_comeron2012.py –winLen 1000 –gapThresh 1000000 –useAdjacentAvg –retainIntermediates
Citations
Comeron et al, 2012. https://doi.org/10.1371/journal.pgen.1002905
Demographic Models
ID |
Description |
|---|---|
Three epoch African population |
|
Three epoch model for African and European populations |
Three epoch African population
The three epoch (modern, bottleneck, ancestral) model estimated for a single African Drosophila Melanogaster population from Sheehan and Song (2016). Population sizes are estimated by a deep learning model trained on simulation data. NOTE: Due to differences in coalescence units between PSMC (2N) and msms (4N) the number of generations were doubled from PSMC estimates when simulating data from msms in the original publication. We have faithfully represented the published model here.
Details
- ID
African3Epoch_1S16
- Description
Three epoch African population
- Num populations
1
Populations
Index |
ID |
Sampling time |
Description |
|---|---|---|---|
0 |
0 |
0 |
African D. melanogaster population |
Citations
Sheehan and Song, 2016. https://doi.org/10.1371/journal.pcbi.1004845
Demographic Model parameters
Parameter Type (units) |
Value |
Description |
|---|---|---|
Population size |
100,000 |
Reference population size |
Population size |
652,700 |
Ancestral pop. Size |
Population size |
145,300 |
Bottleneck pop. size |
Population size |
544,200 |
Recent pop. size |
Epoch Time (gen.) |
2,200,000 |
Onset of bottleneck |
Epoch Time (gen.) |
200,000 |
Population expansion |
Generation time (yrs.) |
0.1 |
Generation time |
Mutation rate |
8.4e-9 |
Per-base per-generation mutation rate |

Three epoch model for African and European populations
The three epoch (modern, bottleneck, ancestral) model estimated for two Drosophila Melanogaster populations: African (ancestral) and European (derived) from Li and Stephan (2006).
Details
- ID
OutOfAfrica_2L06
- Description
Three epoch model for African and European populations
- Num populations
2
Populations
Index |
ID |
Sampling time |
Description |
|---|---|---|---|
0 |
0 |
0 |
African D. melanogaster population |
1 |
1 |
0 |
European D. melanogaster population |
Citations
Li et al., 2006. https://doi.org/10.1371/journal.pgen.0020166
Demographic Model parameters
Parameter Type (units) |
Value |
Description |
|---|---|---|
Population size |
1,720,600 |
Ancestral pop. Size |
Population size |
8,603,000 |
Post-expansion African pop. Size |
Population size |
2,200 |
European bottleneck pop. size |
Population size |
1,075,000 |
Modern European pop. size |
Epoch Time (gen.) |
600,000 |
Expansion of population in Africa |
Epoch Time (gen.) |
158,000 |
African-European divergence |
Epoch Time (gen.) |
154,600 |
European pop. Expansion |
Generation time (yrs.) |
0.1 |
Generation time |
Mutation rate |
1.45e-9 |
Per-base per-generation mutation rate |

Annotations
ID |
Year |
Description |
|---|---|---|
2014 |
FlyBase exon annotations on BDGP6 |
|
2014 |
FlyBase CDS annotations on BDGP6 |
FlyBase_BDGP6.32.51_exons
FlyBase exon annotations on BDGP6
Citations
Hoskins et al, 2014. https://doi.org/10.1101/gr.185579.114
FlyBase_BDGP6.32.51_CDS
FlyBase CDS annotations on BDGP6
Citations
Hoskins et al, 2014. https://doi.org/10.1101/gr.185579.114
Distribution of Fitness Effects (DFEs)
ID |
Year |
Description |
|---|---|---|
2017 |
Deleterious Gamma DFE |
Gamma_H17
Deleterious Gamma DFE
Citations
Huber et al., 2017. https://doi.org/10.1073/pnas.1619508114
Escherichia coli
- ID
EscCol
- Name
Escherichia coli
- Common name
E. coli
- Generation time
3.805175e-05 (Sezonov et al., 2007)
- Population size
180000000.0 (Hartl, Moriyama, and Sawyer, 1994)
Genome
ID |
Length |
Recombination rate |
Mutation rate |
|---|---|---|---|
Chromosome |
4641652 |
0 |
8.9e-11 |
Genetic Maps
ID |
Year |
Description |
|---|
Demographic Models
ID |
Description |
|---|
Annotations
ID |
Year |
Description |
|---|
Distribution of Fitness Effects (DFEs)
ID |
Year |
Description |
|---|
Homo sapiens
- ID
HomSap
- Name
Homo sapiens
- Common name
Human
- Generation time
- Population size
10000 (Takahata, 1993)
Genome
ID |
Length |
Recombination rate |
Mutation rate |
|---|---|---|---|
1 |
248956422 |
1.14856e-08 |
1.29e-08 |
2 |
242193529 |
1.10543e-08 |
1.29e-08 |
3 |
198295559 |
1.12796e-08 |
1.29e-08 |
4 |
190214555 |
1.12312e-08 |
1.29e-08 |
5 |
181538259 |
1.12809e-08 |
1.29e-08 |
6 |
170805979 |
1.12229e-08 |
1.29e-08 |
7 |
159345973 |
1.17646e-08 |
1.29e-08 |
8 |
145138636 |
1.14785e-08 |
1.29e-08 |
9 |
138394717 |
1.17807e-08 |
1.29e-08 |
10 |
133797422 |
1.33651e-08 |
1.29e-08 |
11 |
135086622 |
1.17193e-08 |
1.29e-08 |
12 |
133275309 |
1.30502e-08 |
1.29e-08 |
13 |
114364328 |
1.09149e-08 |
1.29e-08 |
14 |
107043718 |
1.11973e-08 |
1.29e-08 |
15 |
101991189 |
1.38358e-08 |
1.29e-08 |
16 |
90338345 |
1.48346e-08 |
1.29e-08 |
17 |
83257441 |
1.58249e-08 |
1.29e-08 |
18 |
80373285 |
1.5076e-08 |
1.29e-08 |
19 |
58617616 |
1.82201e-08 |
1.29e-08 |
20 |
64444167 |
1.71783e-08 |
1.29e-08 |
21 |
46709983 |
1.30452e-08 |
1.29e-08 |
22 |
50818468 |
1.4445e-08 |
1.29e-08 |
X |
156040895 |
1.16466e-08 |
1.29e-08 |
Y |
57227415 |
0 |
1.29e-08 |
MT |
16569 |
0 |
1.29e-08 |
Genetic Maps
ID |
Year |
Description |
|---|---|---|
2007 |
HapMap Phase II lifted over to GRCh37 |
|
2010 |
Sex averaged map from deCode family study |
|
2019 |
Pyrho population-specific map for ACB |
|
2019 |
Pyrho population-specific map for ASW |
|
2019 |
Pyrho population-specific map for BEB |
|
2019 |
Pyrho population-specific map for CDX |
|
2019 |
Pyrho population-specific map for CEU |
|
2019 |
Pyrho population-specific map for CHB |
|
2019 |
Pyrho population-specific map for CHS |
|
2019 |
Pyrho population-specific map for CLM |
|
2019 |
Pyrho population-specific map for ESN |
|
2019 |
Pyrho population-specific map for FIN |
|
2019 |
Pyrho population-specific map for GBR |
|
2019 |
Pyrho population-specific map for GIH |
|
2019 |
Pyrho population-specific map for GWD |
|
2019 |
Pyrho population-specific map for IBS |
|
2019 |
Pyrho population-specific map for ITU |
|
2019 |
Pyrho population-specific map for JPT |
|
2019 |
Pyrho population-specific map for KHV |
|
2019 |
Pyrho population-specific map for LWK |
|
2019 |
Pyrho population-specific map for MSL |
|
2019 |
Pyrho population-specific map for MXL |
|
2019 |
Pyrho population-specific map for PEL |
|
2019 |
Pyrho population-specific map for PJL |
|
2019 |
Pyrho population-specific map for PUR |
|
2019 |
Pyrho population-specific map for STU |
|
2019 |
Pyrho population-specific map for TSI |
|
2019 |
Pyrho population-specific map for YRI |
HapMapII_GRCh37
This genetic map is from the Phase II Hapmap project and based on 3.1 million genotyped SNPs from 270 individuals across four populations (YRI, CEU, CHB and JPT). Genome wide recombination rates were estimated using LDHat. This version of the HapMap genetic map was lifted over to GRCh37 (and adjusted in regions where the genome assembly had rearranged) for use in the 1000 Genomes project. Please see the README file on the 1000 Genomes download site for details of these adjustments. ftp://ftp-trace.ncbi.nih.gov/1000genomes/ftp/technical/working/20110106_recombination_hotspots
Citations
The International HapMap Consortium, 2007. https://doi.org/10.1038/nature06258
DeCodeSexAveraged_GRCh36
This genetic map is from the deCode study of recombination events in 15,257 parent-offspring pairs from Iceland. 289,658 phased autosomal SNPs were used to call recombinations within these families, and recombination rates computed from the density of these events. This is the combined male and female (sex averaged) map. See https://www.decode.com/addendum/ for more details.
Citations
Kong et al, 2010. https://doi.org/10.1038/nature09525
PyrhoACB_GRCh38
This genetic map was inferred using individuals from the ACB population from Phase 3 of the 1000 Genomes Project. Rates were estimated using pyrho (https://github.com/popgenmethods/pyrho) while using population-specific population size history estimates obtained from smc++ (https://github.com/popgenmethods/smcpp). Genetic maps are only available for the 22 autosomes. See https://doi.org/10.1126/sciadv.aaw9206 for more details.
Citations
Spence and Song, 2019. https://doi.org/10.1126/sciadv.aaw9206
PyrhoASW_GRCh38
This genetic map was inferred using individuals from the ASW population from Phase 3 of the 1000 Genomes Project. Rates were estimated using pyrho (https://github.com/popgenmethods/pyrho) while using population-specific population size history estimates obtained from smc++ (https://github.com/popgenmethods/smcpp). Genetic maps are only available for the 22 autosomes. See https://doi.org/10.1126/sciadv.aaw9206 for more details.
Citations
Spence and Song, 2019. https://doi.org/10.1126/sciadv.aaw9206
PyrhoBEB_GRCh38
This genetic map was inferred using individuals from the BEB population from Phase 3 of the 1000 Genomes Project. Rates were estimated using pyrho (https://github.com/popgenmethods/pyrho) while using population-specific population size history estimates obtained from smc++ (https://github.com/popgenmethods/smcpp). Genetic maps are only available for the 22 autosomes. See https://doi.org/10.1126/sciadv.aaw9206 for more details.
Citations
Spence and Song, 2019. https://doi.org/10.1126/sciadv.aaw9206
PyrhoCDX_GRCh38
This genetic map was inferred using individuals from the CDX population from Phase 3 of the 1000 Genomes Project. Rates were estimated using pyrho (https://github.com/popgenmethods/pyrho) while using population-specific population size history estimates obtained from smc++ (https://github.com/popgenmethods/smcpp). Genetic maps are only available for the 22 autosomes. See https://doi.org/10.1126/sciadv.aaw9206 for more details.
Citations
Spence and Song, 2019. https://doi.org/10.1126/sciadv.aaw9206
PyrhoCEU_GRCh38
This genetic map was inferred using individuals from the CEU population from Phase 3 of the 1000 Genomes Project. Rates were estimated using pyrho (https://github.com/popgenmethods/pyrho) while using population-specific population size history estimates obtained from smc++ (https://github.com/popgenmethods/smcpp). Genetic maps are only available for the 22 autosomes. See https://doi.org/10.1126/sciadv.aaw9206 for more details.
Citations
Spence and Song, 2019. https://doi.org/10.1126/sciadv.aaw9206
PyrhoCHB_GRCh38
This genetic map was inferred using individuals from the CHB population from Phase 3 of the 1000 Genomes Project. Rates were estimated using pyrho (https://github.com/popgenmethods/pyrho) while using population-specific population size history estimates obtained from smc++ (https://github.com/popgenmethods/smcpp). Genetic maps are only available for the 22 autosomes. See https://doi.org/10.1126/sciadv.aaw9206 for more details.
Citations
Spence and Song, 2019. https://doi.org/10.1126/sciadv.aaw9206
PyrhoCHS_GRCh38
This genetic map was inferred using individuals from the CHS population from Phase 3 of the 1000 Genomes Project. Rates were estimated using pyrho (https://github.com/popgenmethods/pyrho) while using population-specific population size history estimates obtained from smc++ (https://github.com/popgenmethods/smcpp). Genetic maps are only available for the 22 autosomes. See https://doi.org/10.1126/sciadv.aaw9206 for more details.
Citations
Spence and Song, 2019. https://doi.org/10.1126/sciadv.aaw9206
PyrhoCLM_GRCh38
This genetic map was inferred using individuals from the CLM population from Phase 3 of the 1000 Genomes Project. Rates were estimated using pyrho (https://github.com/popgenmethods/pyrho) while using population-specific population size history estimates obtained from smc++ (https://github.com/popgenmethods/smcpp). Genetic maps are only available for the 22 autosomes. See https://doi.org/10.1126/sciadv.aaw9206 for more details.
Citations
Spence and Song, 2019. https://doi.org/10.1126/sciadv.aaw9206
PyrhoESN_GRCh38
This genetic map was inferred using individuals from the ESN population from Phase 3 of the 1000 Genomes Project. Rates were estimated using pyrho (https://github.com/popgenmethods/pyrho) while using population-specific population size history estimates obtained from smc++ (https://github.com/popgenmethods/smcpp). Genetic maps are only available for the 22 autosomes. See https://doi.org/10.1126/sciadv.aaw9206 for more details.
Citations
Spence and Song, 2019. https://doi.org/10.1126/sciadv.aaw9206
PyrhoFIN_GRCh38
This genetic map was inferred using individuals from the FIN population from Phase 3 of the 1000 Genomes Project. Rates were estimated using pyrho (https://github.com/popgenmethods/pyrho) while using population-specific population size history estimates obtained from smc++ (https://github.com/popgenmethods/smcpp). Genetic maps are only available for the 22 autosomes. See https://doi.org/10.1126/sciadv.aaw9206 for more details.
Citations
Spence and Song, 2019. https://doi.org/10.1126/sciadv.aaw9206
PyrhoGBR_GRCh38
This genetic map was inferred using individuals from the GBR population from Phase 3 of the 1000 Genomes Project. Rates were estimated using pyrho (https://github.com/popgenmethods/pyrho) while using population-specific population size history estimates obtained from smc++ (https://github.com/popgenmethods/smcpp). Genetic maps are only available for the 22 autosomes. See https://doi.org/10.1126/sciadv.aaw9206 for more details.
Citations
Spence and Song, 2019. https://doi.org/10.1126/sciadv.aaw9206
PyrhoGIH_GRCh38
This genetic map was inferred using individuals from the GIH population from Phase 3 of the 1000 Genomes Project. Rates were estimated using pyrho (https://github.com/popgenmethods/pyrho) while using population-specific population size history estimates obtained from smc++ (https://github.com/popgenmethods/smcpp). Genetic maps are only available for the 22 autosomes. See https://doi.org/10.1126/sciadv.aaw9206 for more details.
Citations
Spence and Song, 2019. https://doi.org/10.1126/sciadv.aaw9206
PyrhoGWD_GRCh38
This genetic map was inferred using individuals from the GWD population from Phase 3 of the 1000 Genomes Project. Rates were estimated using pyrho (https://github.com/popgenmethods/pyrho) while using population-specific population size history estimates obtained from smc++ (https://github.com/popgenmethods/smcpp). Genetic maps are only available for the 22 autosomes. See https://doi.org/10.1126/sciadv.aaw9206 for more details.
Citations
Spence and Song, 2019. https://doi.org/10.1126/sciadv.aaw9206
PyrhoIBS_GRCh38
This genetic map was inferred using individuals from the IBS population from Phase 3 of the 1000 Genomes Project. Rates were estimated using pyrho (https://github.com/popgenmethods/pyrho) while using population-specific population size history estimates obtained from smc++ (https://github.com/popgenmethods/smcpp). Genetic maps are only available for the 22 autosomes. See https://doi.org/10.1126/sciadv.aaw9206 for more details.
Citations
Spence and Song, 2019. https://doi.org/10.1126/sciadv.aaw9206
PyrhoITU_GRCh38
This genetic map was inferred using individuals from the ITU population from Phase 3 of the 1000 Genomes Project. Rates were estimated using pyrho (https://github.com/popgenmethods/pyrho) while using population-specific population size history estimates obtained from smc++ (https://github.com/popgenmethods/smcpp). Genetic maps are only available for the 22 autosomes. See https://doi.org/10.1126/sciadv.aaw9206 for more details.
Citations
Spence and Song, 2019. https://doi.org/10.1126/sciadv.aaw9206
PyrhoJPT_GRCh38
This genetic map was inferred using individuals from the JPT population from Phase 3 of the 1000 Genomes Project. Rates were estimated using pyrho (https://github.com/popgenmethods/pyrho) while using population-specific population size history estimates obtained from smc++ (https://github.com/popgenmethods/smcpp). Genetic maps are only available for the 22 autosomes. See https://doi.org/10.1126/sciadv.aaw9206 for more details.
Citations
Spence and Song, 2019. https://doi.org/10.1126/sciadv.aaw9206
PyrhoKHV_GRCh38
This genetic map was inferred using individuals from the KHV population from Phase 3 of the 1000 Genomes Project. Rates were estimated using pyrho (https://github.com/popgenmethods/pyrho) while using population-specific population size history estimates obtained from smc++ (https://github.com/popgenmethods/smcpp). Genetic maps are only available for the 22 autosomes. See https://doi.org/10.1126/sciadv.aaw9206 for more details.
Citations
Spence and Song, 2019. https://doi.org/10.1126/sciadv.aaw9206
PyrhoLWK_GRCh38
This genetic map was inferred using individuals from the LWK population from Phase 3 of the 1000 Genomes Project. Rates were estimated using pyrho (https://github.com/popgenmethods/pyrho) while using population-specific population size history estimates obtained from smc++ (https://github.com/popgenmethods/smcpp). Genetic maps are only available for the 22 autosomes. See https://doi.org/10.1126/sciadv.aaw9206 for more details.
Citations
Spence and Song, 2019. https://doi.org/10.1126/sciadv.aaw9206
PyrhoMSL_GRCh38
This genetic map was inferred using individuals from the MSL population from Phase 3 of the 1000 Genomes Project. Rates were estimated using pyrho (https://github.com/popgenmethods/pyrho) while using population-specific population size history estimates obtained from smc++ (https://github.com/popgenmethods/smcpp). Genetic maps are only available for the 22 autosomes. See https://doi.org/10.1126/sciadv.aaw9206 for more details.
Citations
Spence and Song, 2019. https://doi.org/10.1126/sciadv.aaw9206
PyrhoMXL_GRCh38
This genetic map was inferred using individuals from the MXL population from Phase 3 of the 1000 Genomes Project. Rates were estimated using pyrho (https://github.com/popgenmethods/pyrho) while using population-specific population size history estimates obtained from smc++ (https://github.com/popgenmethods/smcpp). Genetic maps are only available for the 22 autosomes. See https://doi.org/10.1126/sciadv.aaw9206 for more details.
Citations
Spence and Song, 2019. https://doi.org/10.1126/sciadv.aaw9206
PyrhoPEL_GRCh38
This genetic map was inferred using individuals from the PEL population from Phase 3 of the 1000 Genomes Project. Rates were estimated using pyrho (https://github.com/popgenmethods/pyrho) while using population-specific population size history estimates obtained from smc++ (https://github.com/popgenmethods/smcpp). Genetic maps are only available for the 22 autosomes. See https://doi.org/10.1126/sciadv.aaw9206 for more details.
Citations
Spence and Song, 2019. https://doi.org/10.1126/sciadv.aaw9206
PyrhoPJL_GRCh38
This genetic map was inferred using individuals from the PJL population from Phase 3 of the 1000 Genomes Project. Rates were estimated using pyrho (https://github.com/popgenmethods/pyrho) while using population-specific population size history estimates obtained from smc++ (https://github.com/popgenmethods/smcpp). Genetic maps are only available for the 22 autosomes. See https://doi.org/10.1126/sciadv.aaw9206 for more details.
Citations
Spence and Song, 2019. https://doi.org/10.1126/sciadv.aaw9206
PyrhoPUR_GRCh38
This genetic map was inferred using individuals from the PUR population from Phase 3 of the 1000 Genomes Project. Rates were estimated using pyrho (https://github.com/popgenmethods/pyrho) while using population-specific population size history estimates obtained from smc++ (https://github.com/popgenmethods/smcpp). Genetic maps are only available for the 22 autosomes. See https://doi.org/10.1126/sciadv.aaw9206 for more details.
Citations
Spence and Song, 2019. https://doi.org/10.1126/sciadv.aaw9206
PyrhoSTU_GRCh38
This genetic map was inferred using individuals from the STU population from Phase 3 of the 1000 Genomes Project. Rates were estimated using pyrho (https://github.com/popgenmethods/pyrho) while using population-specific population size history estimates obtained from smc++ (https://github.com/popgenmethods/smcpp). Genetic maps are only available for the 22 autosomes. See https://doi.org/10.1126/sciadv.aaw9206 for more details.
Citations
Spence and Song, 2019. https://doi.org/10.1126/sciadv.aaw9206
PyrhoTSI_GRCh38
This genetic map was inferred using individuals from the TSI population from Phase 3 of the 1000 Genomes Project. Rates were estimated using pyrho (https://github.com/popgenmethods/pyrho) while using population-specific population size history estimates obtained from smc++ (https://github.com/popgenmethods/smcpp). Genetic maps are only available for the 22 autosomes. See https://doi.org/10.1126/sciadv.aaw9206 for more details.
Citations
Spence and Song, 2019. https://doi.org/10.1126/sciadv.aaw9206
PyrhoYRI_GRCh38
This genetic map was inferred using individuals from the YRI population from Phase 3 of the 1000 Genomes Project. Rates were estimated using pyrho (https://github.com/popgenmethods/pyrho) while using population-specific population size history estimates obtained from smc++ (https://github.com/popgenmethods/smcpp). Genetic maps are only available for the 22 autosomes. See https://doi.org/10.1126/sciadv.aaw9206 for more details.
Citations
Spence and Song, 2019. https://doi.org/10.1126/sciadv.aaw9206
Demographic Models
ID |
Description |
|---|---|
Three population out-of-Africa |
|
Two population out-of-Africa |
|
African population |
|
American admixture |
|
Three population out-of-Africa with archaic admixture |
|
Periodic growth and decline. |
|
Multi-population model of ancient Eurasia |
|
Out-of-Africa with archaic admixture into Papuans |
|
Ashkenazi Jewish with substructure and European admixture |
|
4 population out of Africa |
|
African-americans population |
Three population out-of-Africa
The three population Out-of-Africa model from Gutenkunst et al. 2009. It describes the ancestral human population in Africa, the out of Africa event, and the subsequent European-Asian population split. Model parameters are the maximum likelihood values of the various parameters given in Table 1 of Gutenkunst et al.
Details
- ID
OutOfAfrica_3G09
- Description
Three population out-of-Africa
- Num populations
3
Populations
Index |
ID |
Sampling time |
Description |
|---|---|---|---|
0 |
0 |
0 |
1000 Genomes YRI (Yoruba) |
1 |
1 |
0 |
1000 Genomes CEU (Utah Residents (CEPH) with Northern and Western European Ancestry |
2 |
2 |
0 |
1000 Genomes CHB (Han Chinese in Beijing, China) |
Citations
Gutenkunst et al., 2009. https://doi.org/10.1371/journal.pgen.1000695
Demographic Model parameters
Parameter Type (units) |
Value |
Description |
|---|---|---|
Population size |
7,300 |
Ancestral pop. size |
Population size |
12,300 |
YRI pop. size |
Population size |
2,100 |
OOA pop. size |
Population size |
1,000 |
CEU pop. size after EU/AS divergence |
Population size |
510 |
CHB pop. size after EU/AS divergence |
Growth rate (per gen.) |
0.004 |
CEU pop. growth rate (per gen.) |
Growth rate (per gen.) |
0.0055 |
CHB pop. growth rate (per gen.) |
Migration rate (x10^-5) |
25 |
YRI-OOA migration rate (per gen.) |
Migration rate (x10^-5) |
3 |
YRI-CEU migration rate (per gen.) |
Migration rate (x10^-5) |
1.9 |
YRI-CHB migration rate (per gen.) |
Migration rate (x10^-5) |
9.6 |
CEU-CHB migration rate (per gen.) |
Epoch Time (gen.) |
8,800 |
Expansion time of ancestral pop. |
Epoch Time (gen.) |
5,600 |
Time of OOA event |
Epoch Time (gen.) |
848 |
Time of CEU-CHB split |
Generation time (yrs.) |
25 |
Generation time |
Mutation rate |
2.35e-8 |
Per-base per-generation mutation rate |

Two population out-of-Africa
The model is derived from the Tennessen et al. analysis of the jSFS from European Americans and African Americans. It describes the ancestral human population in Africa, the out of Africa event, and two distinct periods of subsequent European population growth over the past 23kya. Model parameters are taken from Fig. S5 in Fu et al.
Details
- ID
OutOfAfrica_2T12
- Description
Two population out-of-Africa
- Num populations
2
Populations
Index |
ID |
Sampling time |
Description |
|---|---|---|---|
0 |
0 |
0 |
African Americans |
1 |
1 |
0 |
European Americans |
Citations
Tennessen et al., 2012. https://doi.org/10.1126/science.1219240
Fu et al., 2013. https://doi.org/10.1038/nature11690
Demographic Model parameters
Parameter Type (units) |
Value |
Description |
|---|---|---|
Population size |
7,310 |
Ancestral pop. size |
Population size |
14,474 |
AFR pop. size |
Population size |
1,861 |
OOA pop. size |
Population size |
1,032 |
EU pop. size after EU/AS divergence |
Population size |
9,279 |
EU pop. size after 1st expansion |
Population size |
501,436 |
EU pop. size after 2nd expansion |
Population size |
432,125 |
AFR pop. size after 1st expansion |
Growth rate (per gen.) |
0.00307 |
EU pop. growth rate 1st expansion |
Growth rate (per gen.) |
0.0195 |
EU pop. growth rate 2st expansion |
Growth rate (per gen.) |
0.0166 |
AFR pop. growth rate 1st expansion |
Migration rate (x10^-5 per gen.) |
15 |
AFR-OOA migration rate |
Migration rate (x10^-5 per gen.) |
2.5 |
AFR-EU migration rate (both expansions) |
Epoch Time (gen.) |
5,920 |
Expansion time of ancestral pop. |
Epoch Time (gen.) |
2,040 |
Time of OOA event |
Epoch Time (gen.) |
920 |
Beginning of 1st EU growth period |
Epoch Time (gen.) |
204.6 |
Beginning of 2nd EU/1st AFR growth period |
Generation time (yrs.) |
25 |
Generation time |
Mutation rate |
2.36e-8 |
Per-base per-generation mutation rate |

African population
The model is a simplification of the two population Tennesen et al. model with the European-American population removed so that we are modeling the African population in isolation.
Details
- ID
Africa_1T12
- Description
African population
- Num populations
1
Populations
Index |
ID |
Sampling time |
Description |
|---|---|---|---|
0 |
0 |
0 |
African |
Citations
Tennessen et al., 2012. https://doi.org/10.1126/science.1219240
Demographic Model parameters
Parameter Type (units) |
Value |
Description |
|---|---|---|
Population size |
7,310 |
Ancestral pop. size |
Population size |
14,474 |
AFR pop. size |
Population size |
432,125 |
AFR pop. size after 1st expansion |
Growth rate (per gen.) |
0.0166 |
AFR pop. growth rate 1st expansion |
Epoch Time (gen.) |
5,920 |
Expansion time of ancestral pop. |
Epoch Time (gen.) |
204.6 |
Beginning of AFR growth period |
Generation time (yrs.) |
25 |
Generation time |
Mutation rate |
2.36e-8 |
Per-base per-generation mutation rate |

American admixture
Demographic model for American admixture, taken from Browning et al. 2011. This model extends the Gravel et al. (2011) model of African/European/Asian demographic history to simulate an admixed population with admixture occurring 12 generations ago. The admixed population had an initial size of 30,000 and grew at a rate of 5% per generation, with 1/6 of the population of African ancestry, 1/3 European, and 1/2 Asian. Note that this demographic model was not inferred, and the mutation rate that Browning et al. used for simulation is smaller than used for inferring the model, so the mutation rate provided here is that from Gravel et al.
Details
- ID
AmericanAdmixture_4B11
- Description
American admixture
- Num populations
4
Populations
Index |
ID |
Sampling time |
Description |
|---|---|---|---|
0 |
0 |
0 |
Contemporary African population |
1 |
1 |
0 |
Contemporary European population |
2 |
2 |
0 |
Contemporary Asian population |
3 |
3 |
0 |
Modern admixed population |
Citations
Browning et al., 2018. http://dx.doi.org/10.1371/journal.pgen.1007385
Gravel et al., 2011. https://doi.org/10.1073/pnas.1019276108
Demographic Model parameters
Parameter Type (units) |
Value |
Description |
|---|---|---|
Population size |
7,310 |
Ancestral pop. size |
Population size |
14,474 |
AFR pop. size |
Population size |
1,861 |
OOA pop. size |
Population size |
1,032 |
EU pop. size after EU/AS divergence |
Population size |
554 |
ASN pop. size after EU/AS divergence |
Population size |
30,000 |
Initial ADMIX pop. size |
Growth rate (per gen.) |
0.0038 |
EU pop. growth rate (per gen.) |
Growth rate (per gen.) |
0.0048 |
ASN pop. growth rate (per gen.) |
Growth rate (per gen.) |
0.05 |
ADMIX pop. growth rate (per gen.) |
Migration rate (x10^-5) |
15 |
AFR-OOA migration rate (per gen.) |
Migration rate (x10^-5) |
2.5 |
AFR-EU migration rate (per gen.) |
Migration rate (x10^-5) |
0.78 |
AFR-ASN migration rate (per gen.) |
Migration rate (x10^-5) |
3.11 |
EU-ASN migration rate (per gen.) |
Epoch Time (gen.) |
5,920 |
Expansion time of ancestral pop. |
Epoch Time (gen.) |
2,040 |
Time of OOA event |
Epoch Time (gen.) |
920 |
Time of EU-ASN split |
Epoch Time (gen.) |
12 |
Time of ADMIX population emergence |
ADMIX percentage |
1/6 |
Amount African admixture |
ADMIX percentage |
1/3 |
Amount European admixture |
ADMIX percentage |
1/2 |
Amount Asian admixture |
Generation time (yrs.) |
25 |
Generation time |
Mutation rate |
2.36e-8 |
Per-base per-generation mutation rate |

Three population out-of-Africa with archaic admixture
The three population out-of-African model popularized by Gutenkunst et al. (2009) and augmented by archaic contributions to both Eurasian and African populations. Two archaic populations split early in human history, before the African expansion, and contribute to Eurasian populations (putative Neanderthal branch) and to the African branch (a deep diverging branch within Africa). Admixture is modeled as symmetric migration between the archaic and modern human branches, with contribution ending at a given time in the past.
Details
- ID
OutOfAfricaArchaicAdmixture_5R19
- Description
Three population out-of-Africa with archaic admixture
- Num populations
5
Populations
Index |
ID |
Sampling time |
Description |
|---|---|---|---|
0 |
0 |
0 |
1000 Genomes YRI (Yoruba) |
1 |
1 |
0 |
1000 Genomes CEU (Utah Residents (CEPH) with Northern and Western European Ancestry |
2 |
2 |
0 |
1000 Genomes CHB (Han Chinese in Beijing, China) |
3 |
3 |
None |
Putative Neanderthals |
4 |
4 |
None |
Putative Archaic Africans |
Citations
Ragsdale and Gravel, 2019. https://doi.org/10.1371/journal.pgen.1008204
Demographic Model parameters
Parameter Type (units) |
Value |
Description |
|---|---|---|
Population size |
3,600 |
Ancestral pop. size |
Population size |
13,900 |
YRI pop. size |
Population size |
880 |
OOA pop. size |
Population size |
2,300 |
CEU pop. size after EU/AS divergence |
Population size |
650 |
CHB pop. size after EU/AS divergence |
Growth rate (per gen.) |
0.00125 |
CEU pop. growth rate (per gen.) |
Growth rate (per gen.) |
0.00372 |
CHB pop. growth rate (per gen.) |
Migration rate (x10^-5) |
52.2 |
YRI-OOA migration rate (per gen.) |
Migration rate (x10^-5) |
2.48 |
YRI-CEU migration rate (per gen.) |
Migration rate (x10^-5) |
0 |
YRI-CHB migration rate (per gen.) |
Migration rate (x10^-5) |
11.3 |
CEU-CHB migration rate (per gen.) |
Time (kya) |
300 |
Expansion time of ancestral pop. |
Time (kya) |
60.7 |
Time of OOA event |
Time (kya) |
36 |
Time of CEU-CHB split |
Time (kya) |
499 |
Archaic African split time |
Time (kya) |
125 |
Archaic African migration begins |
Migration rate (x10^-5) |
1.98 |
Arch Afr-Nean migration rate (per gen.) |
Time (kya) |
559 |
Neanderthal split time |
Migration rate (x10^-5) |
0.825 |
OOA pops-Nean migration rate (per gen.) |
Time (kya) |
18.7 |
Archaic migrations end |
Generation time (yrs.) |
29 |
Generation time |

Periodic growth and decline.
A validation model used by Schiffels and Durbin (2014) and Terhorst and Terhorst, Kamm, and Song (2017) with periods of exponential growth and decline in a single population.
Details
- ID
Zigzag_1S14
- Description
Periodic growth and decline.
- Num populations
1
Populations
Index |
ID |
Sampling time |
Description |
|---|---|---|---|
0 |
0 |
0 |
Generic expanding and contracting population |
Citations
Schiffels and Durbin, 2014. https://doi.org/10.1038/ng.3015
Demographic Model parameters
Parameter Type (units) |
Value |
Description |
|---|---|---|
Population size |
7,156 |
Ancient pop. size |
Population size |
71,560 |
Recent pop. size |
Growth rate (per gen.) |
8.99448 x 10^(-5) |
Growth rate for 1st growth |
Growth rate (per gen.) |
-0.00035977 |
Growth rate for 1st decline |
Growth rate (per gen.) |
0.0014391 |
Growth rate for 2nd growth |
Growth rate (per gen.) |
-0.005756 |
Growth rate for 2rd decline |
Growth rate (per gen.) |
0.023025 |
Growth rate for 3st growth |
Time (gen.) |
34,133.31 |
Beginning of 1st growth |
Time (gen.) |
8,533.33 |
Beginning of 1st decline |
Time (gen.) |
2,133.33 |
Beginning of 2nd growth |
Time (gen.) |
533.33 |
Beginning of 2nd decline |
Time (gen.) |
133.33 |
Beginning of 3rd growth |
Time (gen.) |
33.333 |
End of 3rd growth |
Generation time |
30 |
Generation time in years |

Multi-population model of ancient Eurasia
This is the best-fitting model of a history of multiple ancient and present-day human populations sampled across Eurasia over the past 120,000 years. The fitting was performed using momi2 (Kamm et al. 2019), which uses the multi-population site-frequency spectrum as input data. The model includes a ghost admixture event (from unsampled basal Eurasians into early European farmers), and two admixture events where the source is approximately well-known (from Neanderthals into Non-Africans and from Western European hunter-gatherers into modern Sardinians. There are three present-day populations: Sardinians, Han Chinese and African Mbuti. Additionally, there are several ancient samples obtained from fossils dated at different times in the past: the Altai Neanderthal (Prufer et al. 2014), a Mesolithic hunter-gatherer (Lazaridis et al. 2014), a Neolithic early European sample (Lazaridis et al. 2014), and two Palaeolithic modern humans from Siberia - MA1 (Raghavan et al. 2014) and Ust’Ishim (Fu et al. 2014). All the ancient samples are represented by a single diploid genome.
Details
- ID
AncientEurasia_9K19
- Description
Multi-population model of ancient Eurasia
- Num populations
9
Populations
Index |
ID |
Sampling time |
Description |
|---|---|---|---|
0 |
0 |
0 |
Present-day African Mbuti |
1 |
1 |
320 |
Early European farmer (EEF) |
2 |
2 |
0 |
Present-day Sardinian |
3 |
3 |
300 |
Western hunter-gatherer (WHG) |
4 |
4 |
960 |
Upper Palaeolithic MAl’ta culture |
5 |
5 |
0 |
Present-day Han Chinese |
6 |
6 |
1800 |
early Palaeolithic Ust’-Ishim |
7 |
7 |
2000 |
Altai Neanderthal from Siberia |
8 |
8 |
None |
Basal Eurasians |
Citations
Kamm et al., 2019. https://doi.org/10.1080/01621459.2019.1635482
Demographic Model parameters
Parameter Type (units) |
Value |
Description |
|---|---|---|
Population size |
17,300 |
Mbuti pop. size |
Population size |
75.7 |
EEF pop. size |
Population size |
15,000 |
Sardinian pop. size |
Population size |
1,920 |
Size of WHG, Bazal, Mal’ta and Ust’-Ishim populations |
Population size |
6,300 |
Han Chinese pop. size |
Population size |
86.9 |
Neanderthal pop. size after exp. decline |
Population size |
2,340 |
(WHG + Han chinese) pop. size before divergence |
Population size |
29,100 |
(WHG + Mbuti) pop. size before divergence |
Population size |
18,200 |
Ancestral pop. size and Nean. size before exp. decline |
Population size |
12,000 |
(Sardinian + EEF) pop. size before divergence |
Time (yrs.) |
696,000 |
Time of WHG and Neanderthal split |
Time (yrs.) |
95,800 |
Time of WHG and Mbuti split, start of Nean. decline |
Time (yrs.) |
79,800 |
Time of WHG and Bazal split |
Time (yrs.) |
51,500 |
Time of WHG and Ust’Ishim split |
Time (yrs.) |
50,400 |
Time of WHG and Han Chinese split |
Time (yrs.) |
44,900 |
Time of WHG and Mal’ta split |
Time (yrs.) |
37,700 |
Time of WHG and EEF split |
Time (yrs.) |
7,690 |
Time of EEF and Sardinian split |
Time (yrs.) |
56,800 |
Time of Neanderthal to Eurasian (WHG) admixture |
Time (yrs.) |
33,700 |
Time of Bazal to EEF admixture |
Time (yrs.) |
1,230 |
Time of WHG to Sardinian admixture |
ADMIX percentage |
2.96 |
Amount of Neanderthal admixture in Eurasian pop. |
ADMIX percentage |
9.36 |
Amount of Bazal admixture in EEF pop. |
ADMIX percentage |
3.17 |
Amount of WHG admixture in Sardinian pop. |
Time (yrs.) |
8,000 |
Time of EEF samples |
Time (yrs.) |
7,500 |
Time of WHG samples |
Time (yrs.) |
24,000 |
Time of MAl’ta samples |
Time (yrs.) |
45,000 |
Time of Ust’-Ishim samples |
Time (yrs.) |
50,000 |
Time of Neanderthal samples |
Generation time (yrs.) |
25 |
Generation time |
Mutation rate |
1.22e-8 |
Per-base per-generation mutation rate |

Out-of-Africa with archaic admixture into Papuans
A ten population model of out-of-Africa, including two pulses of Denisovan admixture into Papuans, and several pulses of Neandertal admixture into non-Africans. Most parameters are from Jacobs et al. (2019), Table S5 and Figure S5. This model is an extension of one from Malaspinas et al. (2016), thus some parameters are inherited from there.
Details
- ID
PapuansOutOfAfrica_10J19
- Description
Out-of-Africa with archaic admixture into Papuans
- Num populations
10
Populations
Index |
ID |
Sampling time |
Description |
|---|---|---|---|
0 |
0 |
0 |
1000 Genomes YRI (Yoruba) |
1 |
1 |
0 |
1000 Genomes CEU (Utah Residents (CEPH) with Northern and Western European Ancestry |
2 |
2 |
0 |
1000 Genomes CHB (Han Chinese in Beijing, China) |
3 |
3 |
0 |
Papuans from Indonesia and New Guinea |
4 |
4 |
2058 |
Altai Denisovan (sampling) lineage |
5 |
5 |
2612 |
Altai Neandertal (sampling) lineage |
6 |
6 |
None |
Denisovan D1 (introgressing) lineage |
7 |
7 |
None |
Denisovan D2 (introgressing) lineage |
8 |
8 |
None |
Neandertal N1 (introgressing) lineage |
9 |
9 |
None |
Out-of-Africa lineage |
Citations
Jacobs et al., 2019. https://doi.org/10.1016/j.cell.2019.02.035
Malaspinas et al., 2016. https://doi.org/10.1038/nature18299
Demographic Model parameters
Parameter Type (units) |
Value |
Description |
|---|---|---|
Population size |
48,433 |
African pop. size |
Population size |
6,962 |
European pop. size |
Population size |
9,025 |
East Asian pop. size |
Population size |
8,834 |
Papuan pop. size |
Population size |
5,083 |
Altai Denisovan pop. size |
Population size |
826 |
Altai Neandertal pop. size |
Population size |
13,249 |
Introgressing Denisovan D1 pop. size |
Population size |
13,249 |
Introgressing Denisovan D2 pop. size |
Population size |
13,249 |
Introgressing Neandertal pop. size |
Population size |
8,516 |
Ghost (out-of-Africa lineage) pop. size |
Population size |
12,971 |
(European + East Asian) pop. size before divergence |
Population size |
41,563 |
(Ghost + African) pop. size before divergence |
Population size |
13,249 |
(Denisovan + Neandertal) pop. size before divergence |
Population size |
32,671 |
(Human + Archaic) pop. size before divergence |
Population size |
100 |
(Altai Denisovan + Introgressing Denisovan D1) pop. size before divergence |
Population size |
100 |
(Altai Denisovan + Introgressing Denisovan D2) pop. size before divergence |
Population size |
13,249 |
(Altai Neandertal + Introgressing Neandertal) pop. size before divergence |
Time (yrs.) |
37,497 |
Time of European and East Asian split |
Time (yrs.) |
50,982 |
Time of Ghost and (European + East Asian) split |
Time (yrs.) |
51,736 |
Time of Ghost and Papuan split |
Time (yrs.) |
64,322 |
Time of Ghost and African split |
Time (yrs.) |
97,875 |
Time of Altai Neandertal and Introgressing Neandertal split |
Time (yrs.) |
282,750 |
Time of Altai Denisovan and Introgressing Denisovan D1 split |
Time (yrs.) |
362,500 |
Time of Altai Denisovan and Introgressing Denisovan D2 split |
Time (yrs.) |
437,610 |
Time of Denisovan and Neandertal split |
Time (yrs.) |
586,525 |
Time of Human and Archaic split |
Population size |
2,231 |
(European + East Asian) bottleneck pop. size |
Population size |
243 |
Papuan bottleneck pop. size |
Population size |
1,394 |
Ghost (out-of-Africa) bottleneck pop. size |
Time (yrs.) |
48,111 |
Time of the (European + East Asian) bottleneck |
Time (yrs.) |
48,865 |
Time of the Papuan bottleneck |
Time (yrs.) |
61,451 |
Time of the Ghost (out-of-Africa) bottleneck |
ADMIX percentage |
2.2 |
Amount of Denisovan D1 admixture in Papaun pop. |
ADMIX percentage |
1.8 |
Amount of Denisovan D2 admixture in Papaun pop. |
ADMIX percentage |
2.4 |
Amount of Neandertal admixture in Ghost pop. |
ADMIX percentage |
1.1 |
Amount of Neandertal admixture in (European + East Asian) pop. |
ADMIX percentage |
0.2 |
Amount of Neandertal admixture in Papuan pop. |
ADMIX percentage |
0.2 |
Amount of Neandertal admixture in East Asian pop. |
Time (yrs.) |
29,800 |
Time of Denisovan D1 to Papuan admixture |
Time (yrs.) |
45,700 |
Time of Denisovan D2 to Papuan admixture |
Time (yrs.) |
53,737 |
Time of Neandertal to Ghost admixture |
Time (yrs.) |
45,414 |
Time of Neandertal to (European + East Asian) admixture |
Time (yrs.) |
40,948 |
Time of Neandertal to Papuan admixture |
Time (yrs.) |
25,607 |
Time of Neandertal to East Asian admixture |
Migration rate (x10^-4) |
1.79 |
Ghost–African migration rate |
Migration rate (x10^-4) |
4.42 |
Ghost–European migration rate |
Migration rate (x10^-4) |
31.4 |
European–East Asian migration rate |
Migration rate (x10^-4) |
57.2 |
East Asian–Papuan migration rate |
Migration rate (x10^-4) |
5.72 |
(European + East Asian)–Papuan migration rate |
Migration rate (x10^-4) |
4.42 |
(European + East Asian)–Ghost migration rate |
Time (yrs.) |
37,497 |
(European + East Asian)–Papuan migration begins |
Time (yrs.) |
37,497 |
(European + East Asian)–Ghost migration begins |
Generation time (yrs.) |
29 |
Generation time |
Mutation rate |
1.4e-8 |
Per-base per-generation mutation rate |

Ashkenazi Jewish with substructure and European admixture
This was the best fit model of Ashkenazi Jewish demographic history from Gladstein and Hammer 2019, shown in Figure 1, labeled “Substructure Model”. Model choice and parameter estimation were performed with Approximate Bayesian Computation. Parameter values are based on the mode from ABC found in Table S3 of Gladstein and Hammer 2019. In this model, the ancestors of Europeans and Middle Eastern populations diverge. Non-Ashkenazi Jewish populations then diverge from the Middle Eastern population. The Ashkenazi Jews then diverge from the other Jewish populations and experience a substantial reduction in population size and a single pulse of gene flow from Europeans (corresponding to their arrival in Europe). After the gene flow from Europeans to the Ashkenazi Jews, the Ashkenazi Jews split into two groups, the Western and Eastern. Finally, the Western Ashkenazi Jews experience moderate instantaneous population size increase, and the Eastern experience a massive population size increase. In addition to the demographic model Gladstein and Hammer 2019 also incorporated an SNP array ascertainment scheme into the simulation. This demographic model does not include the SNP array ascertainment scheme. It should be noted that Gladstein and Hammer 2019 simulated with a mutation rate of 2.5e-8.
Details
- ID
AshkSub_7G19
- Description
Ashkenazi Jewish with substructure and European admixture
- Num populations
7
Populations
Index |
ID |
Sampling time |
Description |
|---|---|---|---|
0 |
0 |
0 |
1000 Genomes YRI (Yoruba) |
1 |
1 |
0 |
1000 Genomes CHB (Han Chinese in Beijing, China) |
2 |
2 |
0 |
1000 Genomes CEU (Utah Residents (CEPH) with Northern and Western European Ancestry |
3 |
3 |
0 |
Middle Eastern |
4 |
4 |
0 |
non-Ashkenazi Jewish |
5 |
5 |
0 |
Western Ashkenazi Jewish |
6 |
6 |
0 |
Eastern Ashkenazi Jewish |
Citations
Gladstein and Hammer, 2019. https://doi.org/10.1093/molbev/msz047
Demographic Model parameters
Parameter Type (units) |
Value |
Description |
|---|---|---|
Population size |
7,300 |
Ancestral African pop. size |
Population size |
18,197 |
YRI pop. size |
Population size |
4,073 |
CHB pop. size |
Population size |
33,113 |
CEU pop. size |
Population size |
436,515 |
Middle Eastern pop. size |
Population size |
354,813 |
non-AJ Jewish pop. size |
Population size |
6,606 |
Western AJ pop. size |
Population size |
1,949,844 |
Eastern AJ founder pop. size |
Epoch Time (gen.) |
8,800 |
Expansion time of YRI ancestral pop. |
Epoch Time (gen.) |
2,105 |
Time of OOA event |
Epoch Time (gen.) |
850 |
Time of CEU-CHB split |
Epoch Time (gen.) |
481 |
Time of Middle Eastern-CEU split |
Epoch Time (gen.) |
211 |
Time of Jewish-Middle Eastern split |
Epoch Time (gen.) |
29 |
Time of AJ-Jewish split |
Epoch Time (gen.) |
28 |
Time of geneflow (not inferred) |
Epoch Time (gen.) |
14 |
Time of Eastern-Western AJ split |
Epoch Time (gen.) |
13 |
Time of AJ growth (not inferred) |
ADMIX percentage |
0.17 |
European to AJ gene flow |
Generation time (yrs.) |
25 |
Generation time |
Mutation rate |
2.5e-8 |
Per-base per-generation mutation rate |

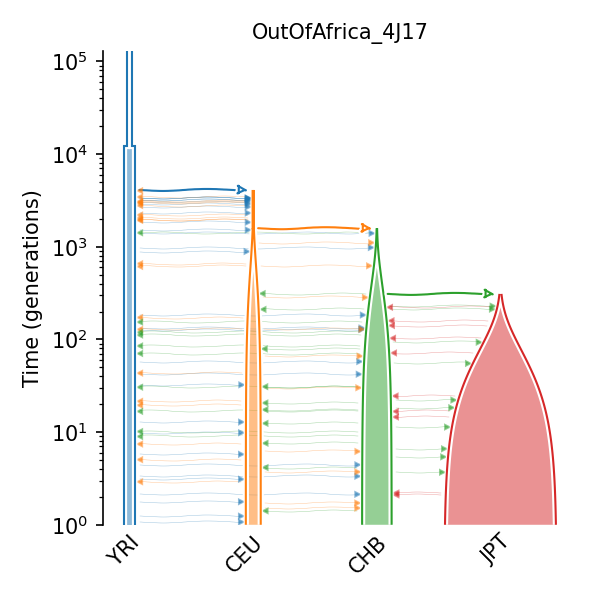
4 population out of Africa
Demographic model for a four population out-of-Africa history, taken from Jouganous et al. (2017). Parameter values were taken from table 4 in the main text. This model was fit based on joint allele frequecy spectrum (AFS) data from 1000 Genomes exomes from the YRI, CEU, CHB, and JPT poulation samples. The demography follows the previous three-populations out-of-Africa models with an additional population split in Asia leading to the Japanese (JPT) population. Parameter values were estimated with the program Moments assuming a mutation rate of 1.44e-8 and a generation time of 29 years.
Details
- ID
OutOfAfrica_4J17
- Description
4 population out of Africa
- Num populations
4
Populations
Index |
ID |
Sampling time |
Description |
|---|---|---|---|
0 |
0 |
0 |
1000 Genomes YRI (Yoruba) |
1 |
1 |
0 |
1000 Genomes CEU (Utah Residents (CEPH) with Northern and Western European Ancestry |
2 |
2 |
0 |
1000 Genomes CHB (Han Chinese in Beijing, China) |
3 |
3 |
0 |
1000 Genomes JPT (Japanese in Tokyo, Japan) |
Citations
Jouganous et al., 2017. https://doi.org/10.1534/genetics.117.200493
Demographic Model parameters
Parameter Type (units) |
Value |
Description |
|---|---|---|
Population size (individuals) |
11293 |
A (ancestral) population size |
Population size (individuals) |
23721 |
YRI population size |
Population size (individuals) |
2831 |
B (OOA) population size |
Population size (individuals) |
2512 |
CEU (European) initial pop. size after EU/AS divergence |
Population size (individuals) |
1019 |
CHB (Asian) initial pop. size after EU/AS divergence |
Population size (individuals) |
4384 |
JPT (Japanese ) pop. size after split from CHB |
Growth rate (percent per generation) |
0 |
A growth rate |
Growth rate (percent per generation) |
0 |
YRI growth rate |
Growth rate (percent per generation) |
0 |
B growth rate |
Growth rate (percent per generation) |
0.16 |
CEU growth rate |
Growth rate (percent per generation) |
0.26 |
CHB growth rate |
Growth rate (percent per generation) |
1.29 |
JPT growth rate |
Migration rate (fraction per generation) |
16.8e-5 |
YRI-B migration rate |
Migration rate (fraction per generation) |
1.14e-5 |
YRI-CEU migration rate |
Migration rate (fraction per generation) |
0.56e-5 |
YRI-CHB migration rate |
Migration rate (fraction per generation) |
4.75e-5 |
CEU-CHB migration rate |
Migration rate (fraction per generation) |
3.3e-5 |
CHB-JPT migration rate |
Epoch Time (thousands of years ago) |
357 |
Expansion time of ancestral population |
Epoch Time (thousands of years ago) |
119 |
Time of OOA event |
Epoch Time (thousands of years ago) |
46 |
Time of CEU-CHB split |
Epoch Time (thousands of years ago) |
9 |
Time of CHB-JPT split |
Generation time (years) |
29 |
Years per generation |
Mutation rate |
1.44e-8 |
Per-base per-generation mutation rate |
African-americans population
African-American two-epoch instantaneous growth model from Boyko et al 2008, fit to the synonymous SFS for the 11 of 15 African Americans showing the least European ancestry, using coalescent simulations with recombination with the maximum likelihood method of Williamson et al 2005; times were calibrated assuming 3e5 generations since human-chimp divergence and fitting the number of synonymous human-chimp differences. Mutation and recombination rates were assumed to be the same (1.8e-8).
Details
- ID
Africa_1B08
- Description
African-americans population
- Num populations
1
Populations
Index |
ID |
Sampling time |
Description |
|---|---|---|---|
0 |
0 |
0 |
African-Americans from Boyko et al 2008 |
Citations
Boyko et al., 2008. https://doi.org/10.1371/journal.pgen.1000083
Demographic Model parameters
Parameter Type (units) |
Value |
Description |
|---|---|---|
Population size |
7,778 |
Ancestral pop. size |
Population size |
25,636 |
African-americans current pop. size |
Epoch Time (gen.) |
6,809 |
instantaneous expansion time of ancestral pop. |
Mutation rate |
1.80E-08 |
Per-base per-generation mutation rate |

Annotations
ID |
Year |
Description |
|---|---|---|
2018 |
Ensembl Havana exon annotations on GRCh38 |
|
2018 |
Ensembl Havana CDS annotations on GRCh38 |
ensembl_havana_104_exons
Ensembl Havana exon annotations on GRCh38
Citations
Hunt et al, 2018. https://doi.org/10.1093/database/bay119
ensembl_havana_104_CDS
Ensembl Havana CDS annotations on GRCh38
Citations
Hunt et al, 2018. https://doi.org/10.1093/database/bay119
Distribution of Fitness Effects (DFEs)
ID |
Year |
Description |
|---|---|---|
2017 |
Deleterious Gamma DFE |
Gamma_K17
Deleterious Gamma DFE
Citations
Kim et al., 2017. https://doi.org/10.1534/genetics.116.197145
Pongo abelii
- ID
PonAbe
- Name
Pongo abelii
- Common name
Sumatran orangutan
- Generation time
20 (Locke et al., 2011)
- Population size
17900.0 (Locke et al., 2011)
Genome
ID |
Length |
Recombination rate |
Mutation rate |
|---|---|---|---|
1 |
229942017 |
5.19e-09 |
1.5e-08 |
2a |
113028656 |
5.43e-09 |
1.5e-08 |
2b |
135000294 |
5.38e-09 |
1.5e-08 |
3 |
202140232 |
5.36e-09 |
1.5e-08 |
4 |
198332218 |
5.43e-09 |
1.5e-08 |
5 |
183952662 |
5.2e-09 |
1.5e-08 |
6 |
174210431 |
5.22e-09 |
1.5e-08 |
7 |
157549271 |
5.73e-09 |
1.5e-08 |
8 |
153482349 |
5.67e-09 |
1.5e-08 |
9 |
135191526 |
5.34e-09 |
1.5e-08 |
10 |
133410057 |
5.91e-09 |
1.5e-08 |
11 |
132107971 |
5.29e-09 |
1.5e-08 |
12 |
136387465 |
5.44e-09 |
1.5e-08 |
13 |
117095149 |
4.91e-09 |
1.5e-08 |
14 |
108868599 |
4.7e-09 |
1.5e-08 |
15 |
99152023 |
4.82e-09 |
1.5e-08 |
16 |
77800216 |
6.12e-09 |
1.5e-08 |
17 |
73212453 |
7.26e-09 |
1.5e-08 |
18 |
94050890 |
4.57e-09 |
1.5e-08 |
19 |
60714840 |
7.56e-09 |
1.5e-08 |
20 |
62736349 |
5.83e-09 |
1.5e-08 |
21 |
48394510 |
4.98e-09 |
1.5e-08 |
22 |
46535552 |
6.03e-09 |
1.5e-08 |
X |
156195299 |
9.5e-09 |
1.5e-08 |
MT |
16499 |
0 |
1.5e-08 |
Genetic Maps
ID |
Year |
Description |
|---|---|---|
2017 |
From Nater et al. (2017) for Pongo abelii |
|
2017 |
From Nater et al. (2017) for Pongo pygmaeus |
NaterPA_PonAbe2
This genetic map is from the Nater et al. (2017) study, inferred using LDhat from n=15 whole-genome sequenced Sumatran orangutan individuals. See https://doi.org/10.1016/j.cub.2017.09.047 for more details.
Citations
Nater et al., 2017. https://doi.org/10.1016/j.cub.2017.09.047
NaterPP_PonAbe2
This genetic map is from the Nater et al. (2017) study, inferred using LDhat from n=20 whole-genome sequenced Bornean orangutan individuals. See https://doi.org/10.1016/j.cub.2017.09.047 for more details.
Citations
Nater et al., 2017. https://doi.org/10.1016/j.cub.2017.09.047
Demographic Models
ID |
Description |
|---|---|
Two population orangutan model |
Two population orangutan model
The two orang-utan species, Sumatran (Pongo abelii) and Bornean (Pongo pygmaeus) inferred from the joint-site frequency spectrum with ten individuals from each population. This model is an isolation-with- migration model, with exponential growth or decay in each population after the split. The Sumatran population grows in size, while the Bornean population slightly declines.
Details
- ID
TwoSpecies_2L11
- Description
Two population orangutan model
- Num populations
2
Populations
Index |
ID |
Sampling time |
Description |
|---|---|---|---|
0 |
0 |
0 |
Pongo pygmaeus (Bornean) population |
1 |
1 |
0 |
Pongo abelii (Sumatran) population |
Citations
Locke et al., 2011. http://doi.org/10.1038/nature09687
Demographic Model parameters
Parameter Type (units) |
Value |
Description |
|---|---|---|
Population size |
17,934 |
Ancestral pop. size |
Population size |
10,617 |
Pongo pygmaeus pop. size at split |
Population size |
7,317 |
Pongo abelii pop. size at split |
Population size |
8,805 |
Modern Pongo pygmaeus pop. size |
Population size |
37,661 |
Modern Pongo abelii pop. size |
Epoch Time (gen.) |
20,157 |
Species divergence time |
Generation time (yrs.) |
20 |
Generation time |
Mutation rate |
2e-8 |
Per-base per-generation mutation rate |

Annotations
ID |
Year |
Description |
|---|
Distribution of Fitness Effects (DFEs)
ID |
Year |
Description |
|---|
Generic models
In addition to the species-specific models listed in this catalog, stdpopsim offers
a number of generic demographic models that can be run with any species.
These are described in more detail in the API.
Simulations using these generic models must be run via the Python interface; see our
Python tutorial to learn how to do this.